
The Comprehensive Guide to Playwright Performance Test Automation
In previous articles, we introduced Playwright as a software testing solution. It has many capabilities, including mobile device emulation, test recording, and more. It comes with powerful tracing tools that provide detailed insights into metrics such as page load times, network activity, and resource usage.
Performance testing is an often-requested app feature that goes past the bounds of normal unit tests. In a typical performance test, hundreds or thousands of requests (or interactions) are sent to a target app, sometimes in the production environment. This lets teams see how responsive an app is over time, which is particularly important when there are SLAs or compliance guarantees relevant to app performance.
In this article, we will see how developers can create a comprehensive performance testing suite with Playwright. Key metrics like First Contentful Paint will be described, along with techniques like trace viewing, network condition simulation, and ongoing resource consumption monitoring.
Summary of Playwright performance testing best practices
Use an automated tool for performance testing
Automated testing tools introduce several advantages that greatly reduce the work involved in performance testing. Benefits include repeatability, scalability, and established testing conventions. These advantages translate into time savings for engineers, especially when it comes to continuous test suite maintenance.
Beyond this, automation allows developers to specify many browsers and environments, then run tests across all of them. As code is added to the codebase, automated tests can detect issues as soon as they are uploaded.
{{banner-large-dark-2="/banners"}}
Playwright, as one of the most supported cross-platform testing tools, makes it easy to configure a test suite across many browsers and devices. This, along with features like real-world condition simulations, makes it possible to run tests that detect issues that normally wouldn’t be detectable with standard unit testing.
Here’s a basic example test where we set up Playwright to emulate an iPhone 14 environment, monitor page load events, and log the browser’s default performance metrics. Note that when we don’t include any test assertions in a Playwright test, we simply get a passing test. This is useful for now because we are only checking the log output from the test.
const { chromium, devices } = require('playwright');
const iPhone14 = devices['iPhone 14'];

const targetURL = process.env.TEST_URL || 'https://example.com';

(async () => {
  const browser = await chromium.launch();
  const context = await browser.newContext({
    ...iPhone14,
    viewport: { width: 390, height: 844 }
  });


  // load the page
  const page = await context.newPage(targetURL);
  await page.goto();
  await page.waitForLoadState('load');


  // Capture and log performance data directly from the browser
  const performanceData = await page.evaluate(() => JSON.stringify(window.performance));
  console.log("Performance Data:", JSON.parse(performanceData));

  await browser.close();
})();
Establish key performance metrics
Effective testing begins with clear definitions of requirements that can then be baked into testing efforts. Every business has its own set of requirements and priorities, which are commonly described via company documentation, technical plans, and SLAs.
As a best practice, performance testing begins with establishing target performance metrics. The table below shows some key questions and relevant metrics.
First Contentful Paint (FCP) and Largest Contentful Paint (LCP)
FCP and LCP reveal how quickly content appears to users, making them essential metrics for assessing web performance. FCP measures the time it takes for the first visible content (e.g., images or text) to appear, signaling that the page is loading. LCP tracks when the largest content element becomes visible, which often aligns with the moment a page feels fully loaded.
If FCP is fast but LCP lags, it could indicate delays in rendering larger assets, such as background images or videos. Capturing FCP in a test scenario is essential for monitoring initial user engagement, especially on slower connections. By tracking FCP under various conditions, developers can improve elements such as CSS or image optimization to reduce the time before content appears.
Why these metrics matter: A fast FCP reassures users that the page is responsive, while a quick LCP enhances the perceived speed of fully loading a page. In performance testing, tracking the FCP and LCP helps developers pinpoint areas that impact user experience the most. This is especially relevant when it comes time to prioritize optimizations.
Other metrics to know
Here are some other key metrics:
- Cumulative Layout shift (CLS): Have you ever had a slow web page scroll unexpectedly while you were trying to click on something? This is called a “layout shift.” These experiences are annoying for users at best, and at worst they can have catastrophic consequences—such as when a user accidentally clicks a delete button due to unexpected scrolling.
- Interaction to Next Paint (INP): INP measures the responsiveness of a page after it has loaded. In effect, it indicates how quickly an app responds to browser interactions like clicks and taps. (INP is sometimes confused with First Input Delay, or FID, an earlier version of this metric.)
- Navigation timing: This metric provides data on the full navigation cycle, from the start of a page load to the point it becomes interactive. In practice, it helps identify slowdowns at each loading stage (such as slow queries), allowing developers to locate bottlenecks in the page loading process.
- Resource load times: These times measure the loading duration for various resources (images, scripts, stylesheets, etc.) on a page. By logging resource load times, developers can spot inefficient assets and optimize or lazy-load resources that affect overall performance, particularly for mobile users on slower networks.
LCP, INP, and CLS together form the foundation of the Core Web Vitals.
{{banner-small-3="/banners"}}
Code example
In the following code example, we test some of the key metrics mentioned above in an emulated iPhone 14 environment. We will describe each section of the test code, then give the full code to copy.
First we set our target performance metrics. You can adjust these numbers to match your expectations.
const { test, expect, chromium } = require('@playwright/test');
const { devices } = require('playwright');

test.setTimeout(2); // 2 second timeout

const testURL = process.env.TEST_URL || 'https://test.example.com';
const targetFCP = 1800;
const targetLCP = 2500;
const targetTTFB = 600;
Now we can create our test. First, we emulate the iPhone 14 environment, and set network conditions according to our requirements. Then we navigate to the page. Adjust these settings to match your specifications and login process.
test('Measure critical performance metrics', async () => {
  // Launch browser with iPhone 14 emulation
  const browser = await chromium.launch();
  const context = await browser.newContext({
    ...devices['iPhone 14 Pro'],
    viewport: { width: 393, height: 852 },
    deviceScaleFactor: 3 // Retina display simulation
  });

  // Simulate 4G network conditions
  await context.emulateNetworkConditions({
    download: 4 * 1024 * 1024 / 8, // 4 Mbps
    upload: 1.5 * 1024 * 1024 / 8, // 1.5 Mbps
    latency: 40
  });

  const page = await context.newPage();

  // Navigate to test URL (use environment variable in CI/CD)
  await page.goto(testURL);
With the page loaded, we can now capture our performance metrics. This will look something like the following:
// Capture Largest Contentful Paint (LCP)
  const LCP = await page.evaluate(() => new Promise((resolve) => {
    new PerformanceObserver((list) => {
      const entries = list.getEntries();
      resolve(entries.pop()?.startTime || 0);
    }).observe({
      type: 'largest-contentful-paint',
      buffered: true
    });
  }));

  // Capture First Contentful Paint (FCP)
  const FCP = await page.evaluate(() =>
    performance.getEntriesByName('first-contentful-paint')[0]?.startTime || 0
  );

  // Capture Time to First Byte (TTFB)
  const { requestStart, responseStart } = await page.evaluate(() =>
    performance.timing.toJSON()
  );
  const TTFB = responseStart - requestStart;
Finally, we log our performance numbers to the console. Rendering to the console is standard practice, and engineers will be able to see the results in CI/CD runs. However, we might also consider logging these metrics to an external destination where non-technical personnel can view them. There are many approaches to this—examples include log aggregators, reporting dashboards, and email alerts.
// Assert performance thresholds
  console.log(`Performance Metrics:
  - First Contentful Paint: ${FCP}ms
  - Largest Contentful Paint: ${LCP}ms
  - Time to First Byte: ${TTFB}ms`);

  expect(FCP).toBeLessThan(targetFCP);
  expect(LCP).toBeLessThan(targetLCP);
  expect(TTFB).toBeLessThan(targetTTFB);

  await browser.close();
});
Altogether, our test looks like this:
const { test, expect, chromium } = require('@playwright/test');
const { devices } = require('playwright');

test.setTimeout(2); // 2 second timeout

const testURL = process.env.TEST_URL || 'https://test.example.com';
const targetFCP = 1800;
const targetLCP = 2500;
const targetTTFB = 600;

test('Measure critical performance metrics', async () => {
  // Launch browser with iPhone 14 emulation
  const browser = await chromium.launch();
  const context = await browser.newContext({
    ...devices['iPhone 14 Pro'],
    viewport: { width: 393, height: 852 },
    deviceScaleFactor: 3 // Retina display simulation
  });

  // Simulate 4G network conditions
  await context.emulateNetworkConditions({
    download: 4 * 1024 * 1024 / 8, // 4 Mbps
    upload: 1.5 * 1024 * 1024 / 8, // 1.5 Mbps
    latency: 40
  });

  const page = await context.newPage();

  // Navigate to test URL (use environment variable in CI/CD)
  await page.goto(testURL);

  // Capture Largest Contentful Paint (LCP)
  const LCP = await page.evaluate(() => new Promise((resolve) => {
    new PerformanceObserver((list) => {
      const entries = list.getEntries();
      resolve(entries.pop()?.startTime || 0);
    }).observe({
      type: 'largest-contentful-paint',
      buffered: true
    });
  }));

  // Capture First Contentful Paint (FCP)
  const FCP = await page.evaluate(() =>
    performance.getEntriesByName('first-contentful-paint')[0]?.startTime || 0
  );

  // Capture Time to First Byte (TTFB)
  const { requestStart, responseStart } = await page.evaluate(() =>
    performance.timing.toJSON()
  );
  const TTFB = responseStart - requestStart;

  // Assert performance thresholds
  console.log(`Performance Metrics:
  - First Contentful Paint: ${FCP}ms
  - Largest Contentful Paint: ${LCP}ms
  - Time to First Byte: ${TTFB}ms`);

  expect(FCP).toBeLessThan(targetFCP);
  expect(LCP).toBeLessThan(targetLCP);
  expect(TTFB).toBeLessThan(targetTTFB);

  await browser.close();
});
Using an environment variable such as “TEST_URL” is generally recommended as a best practice because it allows for testing in multiple environments. That matters because, unlike with unit tests, there are many situations where we may want to run performance tests against our production environment. For example, a team may want to run a performance test to simulate how its production system will respond to an upcoming holiday rush. The team might also run daily performance tests in a dedicated test environment to see how recent code changes have affected the system once merged together.
{{banner-small-4="/banners"}}
Debug performance issues with Playwright tracing
When an application experiences intermittent slowness, excessive network calls, or inefficient JavaScript execution, tracing can help. Tracing in Playwright captures detailed logs of a test session, recording user interactions, network activity, and resource loading. This level of detail makes tracing invaluable for diagnosing specific performance issues, mainly when it’s challenging to pinpoint why a page may feel slow or unresponsive.
Tracing is ideal for debugging scenarios where traditional logging or performance metrics alone don’t identify the root cause. Using modern techniques like replay, playback, and snapshots, developers and non-technical personnel alike can play through interactions and see their app experiences play out in real time.
Qualiti provides tracing natively in all tests with its Trace Viewer feature. Each step of every test is recorded, so you can see the performance of each part of the test. To get to the feature, navigate to the test in the dashboard and click the “Traces” button, as shown below:
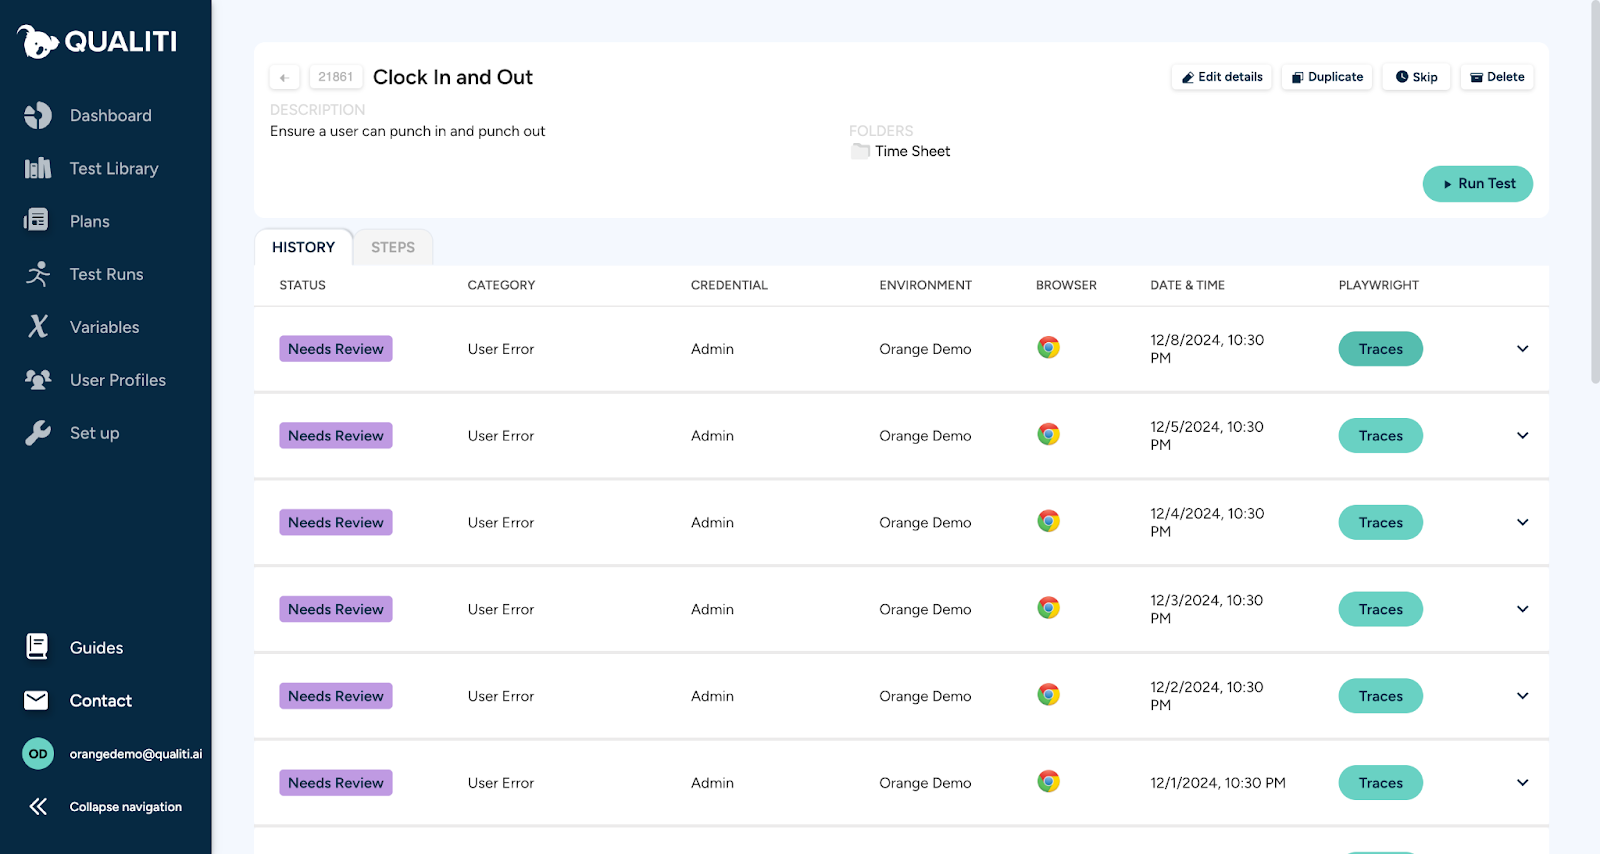
The Trace Viewer displays a screenshot of each step of our test. This lets us replay interactions, with a view of the performance of each step.
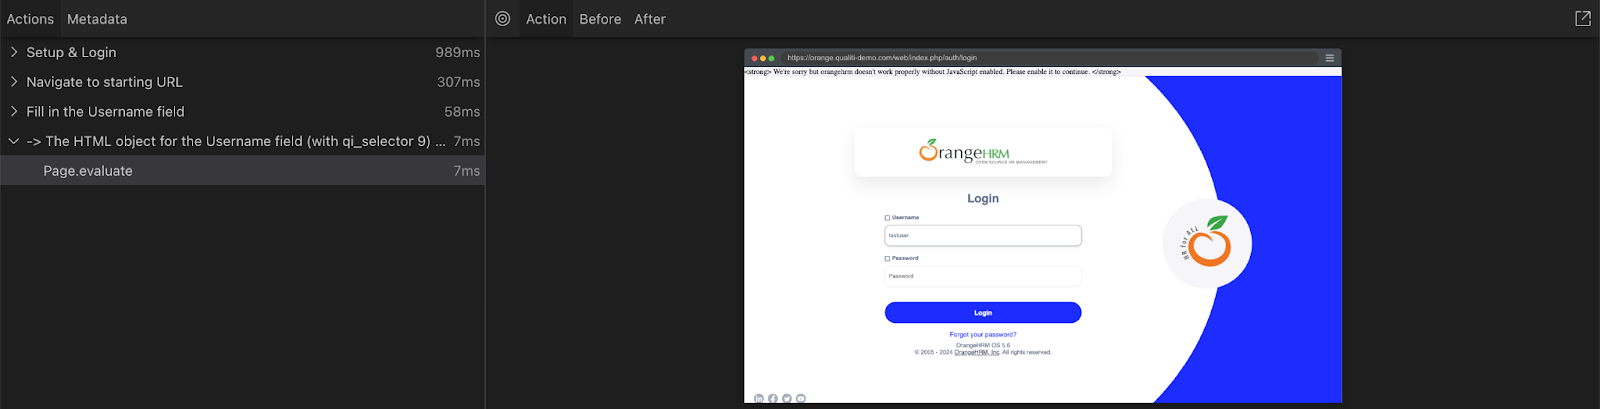
This page is also home to a DevTools console. Similar to a browser inspector, in this panel you can view network request details, media download times, logs and error messages.
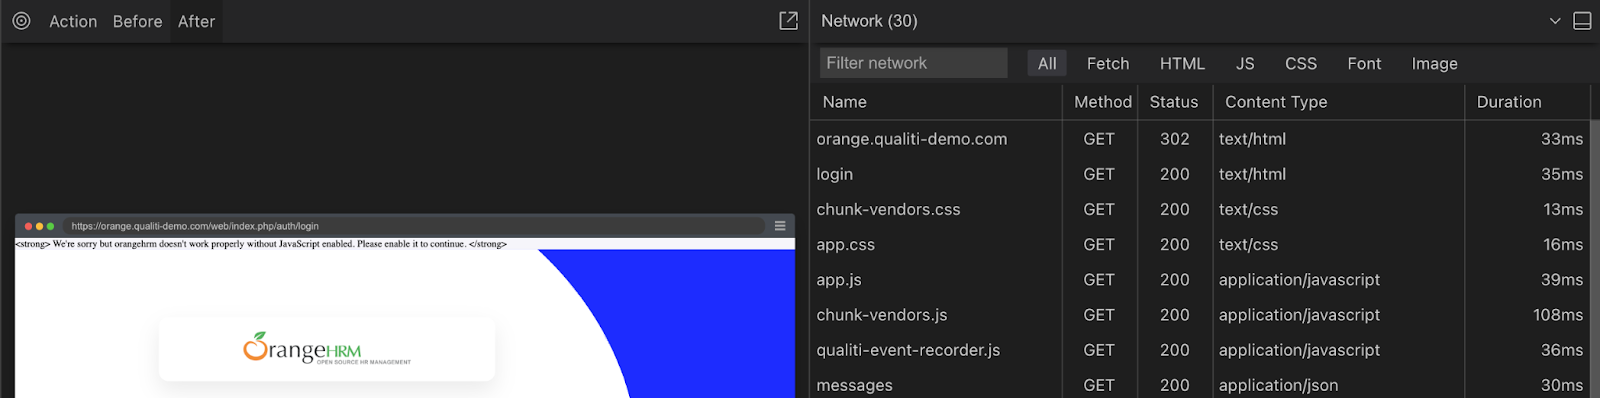
Another common cause of performance issues is unoptimized media, like images, video, audio, and other static files. The “Fetch” section of the Network tab displays all network requests. Large media files can lead to long downloads, potentially causing longer page load times and a diminished user experience. You can inspect all media downloads and identify offending files.
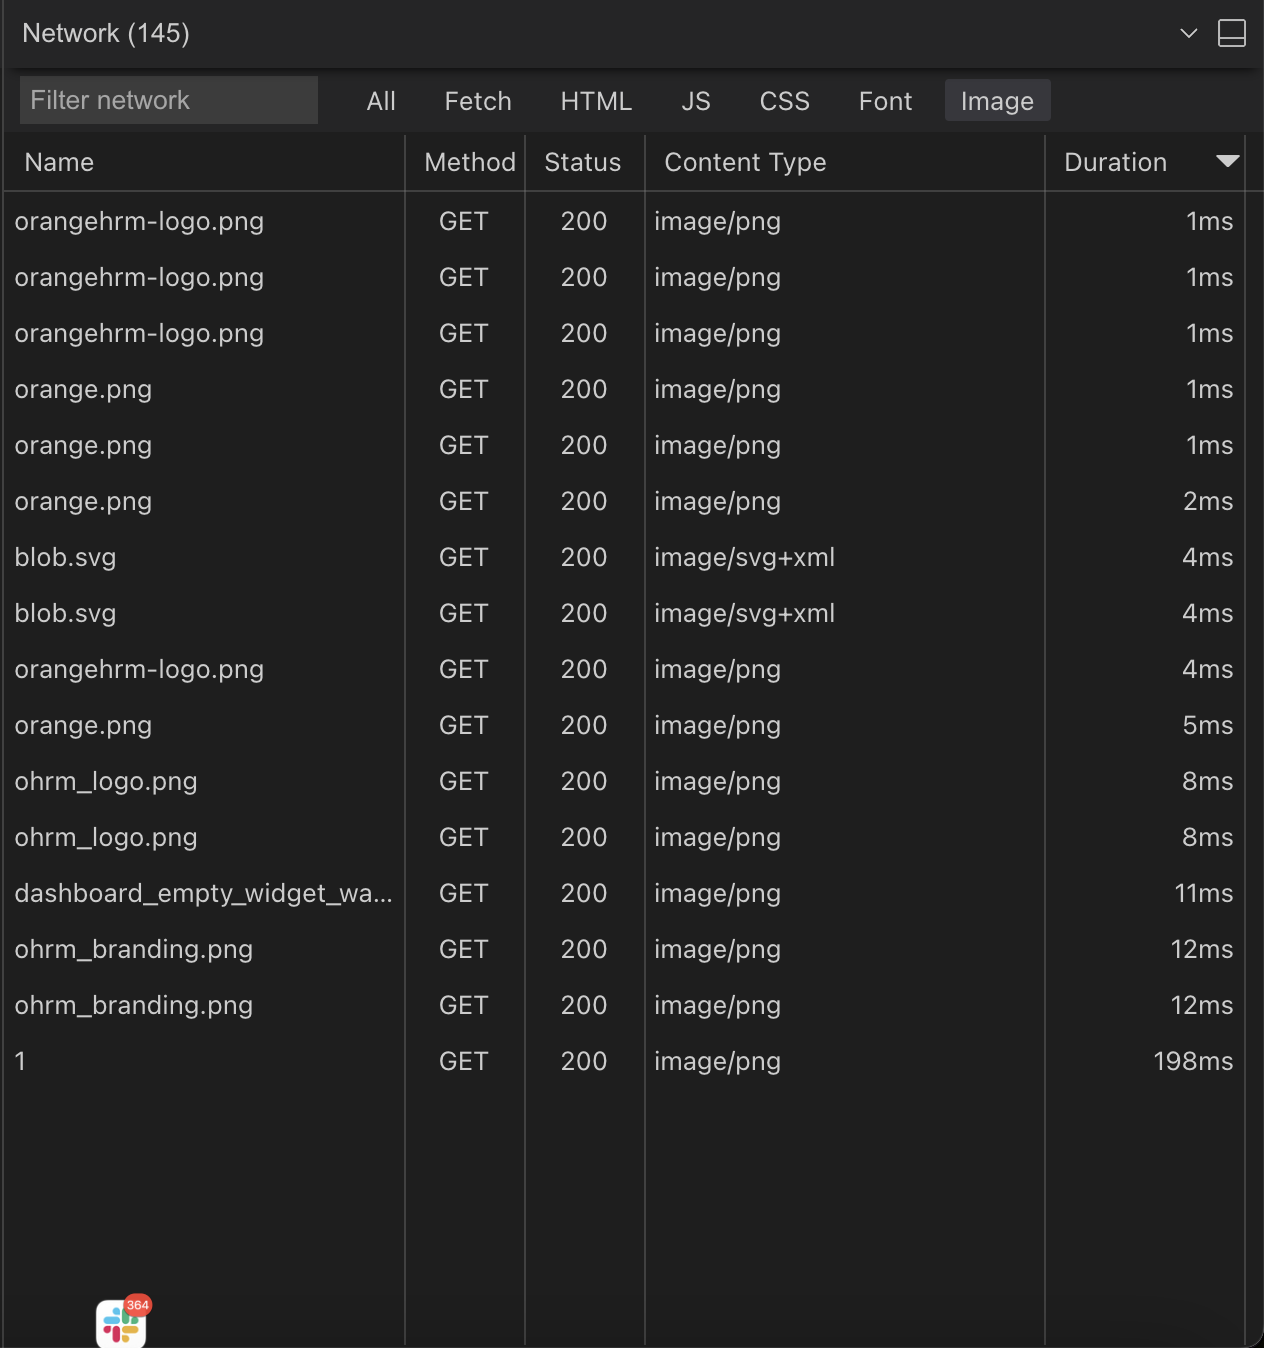
Here we are inspecting our image load times, and we’ve sorted them by download time (duration). We can see one image file, called “1.png”, that is taking 10 times longer than others to download:
Organize and optimize test code for performance
Performance tests tend to grow resource-intensive quickly; it is not uncommon for tens of thousands of requests to be performed per test. Efficient performance tests require clear, maintainable code that will scale as the application grows.
The specifics of how to organize test code will vary depending on your language and framework of choice along with practical considerations. In a legacy, monolithic, front-end-only application, you might see performance checks baked into test code alongside functional test steps. A modern team might be using a leaner infrastructure such as a “lambda-lith” architecture (e.g. Vercel and NextJS). Here, it may be more efficient to isolate performance checks into their own tests.
Some ways engineering teams maintain performance test collections over time include:
- Deduplication: Keep performance test code as lean as possible, looking for situations like looping logic getting out of control and removing duplicate tests and code logic. This often comes up during code refactoring.
- Resource usage optimization: Performance testing requires using a separate machine (or VM) to generate requests against the app under test. Reducing the processing power needed per test will likely bring long-term cost savings.
- Prioritization: Running many performance tests for each part of the app may not be feasible in a large codebase. Engineering teams may, for instance, choose to prefer “happy path” tests that focus on the ideal core user experience (e.g., only testing the web or mobile experience if users heavily favor one over another). The same team might use deeper performance testing when preparing to launch new features.
- Lifecycle hooks: In the codebase, Playwright’s “beforeAll” and “afterAll” hooks enable structured resource management, allowing developers to reuse, isolate, and clean up after tests. They are commonly used for proactive resource orchestration—for instance, these hooks might be used to create mock data before tests run and then delete it as we clean up once tests are complete.
Simulate constrained network conditions in testing
Mobile users often encounter varying network conditions depending on location and connectivity—from high-speed 4G to spotty 3G or even being offline. Businesses whose customers are located in a central location or country will tend to have some baseline expectations for network performance. Online businesses like ecommerce stores may need to account for many kinds of network conditions in many regions.
For these reasons and more, network condition simulations are very beneficial in mobile testing scenarios. Effective testing begins with clear definitions of requirements, which can then be baked into testing efforts.
Testing an app under diverse conditions helps ensure a seamless experience across different environments and network speeds. By simulating slow or unstable connections, developers can evaluate load times, resource handling, and overall user experience, which is essential for apps that must perform reliably on mobile networks.
We simulated a 4G connection in our previous code example. From here, the change to mocking a slow 3G connection is simple:
const cdpSession = await context.newCDPSession(page)
await cdpSession.send('Network.emulateNetworkConditions',
{
  // hardcoded network speed numbers
  download: 780 * 1024 / 8,
  upload: 330 * 1024 / 8,
  latency: 100,
});
Realistically, a team would likely use a separate test for both conditions. Testing with slow network conditions helps developers identify issues like slow resource loading or unresponsive scripts under degraded network conditions. These issues wouldn’t be obvious if testing only with a business-grade computer. Teams can also validate whether lazy-loading images or deferring non-essential scripts improves performance in such environments.
Integrate Playwright performance tests into CI/CD pipelines
A regression is a situation where code updates accidentally introduce new issues onto an app or system. Regressions are perhaps the most common source of bugs in all of software. This is why continuous integration has gained such widespread adoption—it attempts to catch and mitigate regressions as early as possible in the development process.
Automating performance tests as part of the CI/CD pipeline ensures that performance regressions are surfaced early in development. By integrating Playwright with tools like GitHub Actions, developers can continuously monitor key metrics like page load times with every code commit.
An example of setting up a CI/CD job in Github with Playwright looks something like this:
name: Playwright Performance Tests
on: [push]
jobs:
  performance-tests:
    runs-on: ubuntu-latest
    steps:
      - uses: actions/checkout@v4
      - uses: actions/setup-node@v4
      - name: Install dependencies
        run: npm ci
      - name: Install Playwright Browsers
        run: npx playwright install --with-deps
      - name: Run Playwright tests
        run: npx playwright test
With Qualiti’s intelligent parallel test execution, teams can scale their testing efforts, reducing execution time while maintaining comprehensive test coverage. Qualiti enables developers to integrate Playwright tests into CI/CD pipelines quickly. After signing up, connect Qualiti to your code repository, select Playwright tests, and configure parallel execution. This rapid setup—achieved in minutes instead of hours—allows teams to continuously monitor key performance metrics across real-world scenarios without slowing development cycles. Qualiti automates performance checks in every build, ensuring comprehensive, fast, and reliable test coverage. This means teams catch regressions early and can focus on rapid feature development.
Monitor resource consumption during tests
Tracking CPU, memory, and bandwidth consumption during tests is essential for diagnosing performance bottlenecks and optimizing resource-heavy processes. High resource usage can cause sluggishness, crashes, or a poor user experience, especially on less powerful devices. Monitoring these metrics helps developers identify and address inefficient code sections, memory leaks, or bandwidth-heavy assets, which can degrade app performance.
Playwright provides access to detailed resource usage data, helping developers isolate and optimize resource-heavy processes. For example, developers can use browser profiling tools in combination with Playwright’s APIs to monitor resource consumption during a test session:
const cpuUsage = await page.evaluate(() => {
  return window.performance.now();
});
By analyzing which parts of the app consume the most resources, developers can pinpoint areas that need optimization, such as reducing memory leaks or minimizing CPU-intensive scripts.
Using Qualiti for automated performance testing
Qualiti’s AI-powered dashboard allows you to create and manage test suites continuously. It has automatic self-maintenance capabilities, so flaky tests can be resolved as they occur. Combining CI/CD integrations and cross-device testing capabilities allows more comprehensive test coverage.
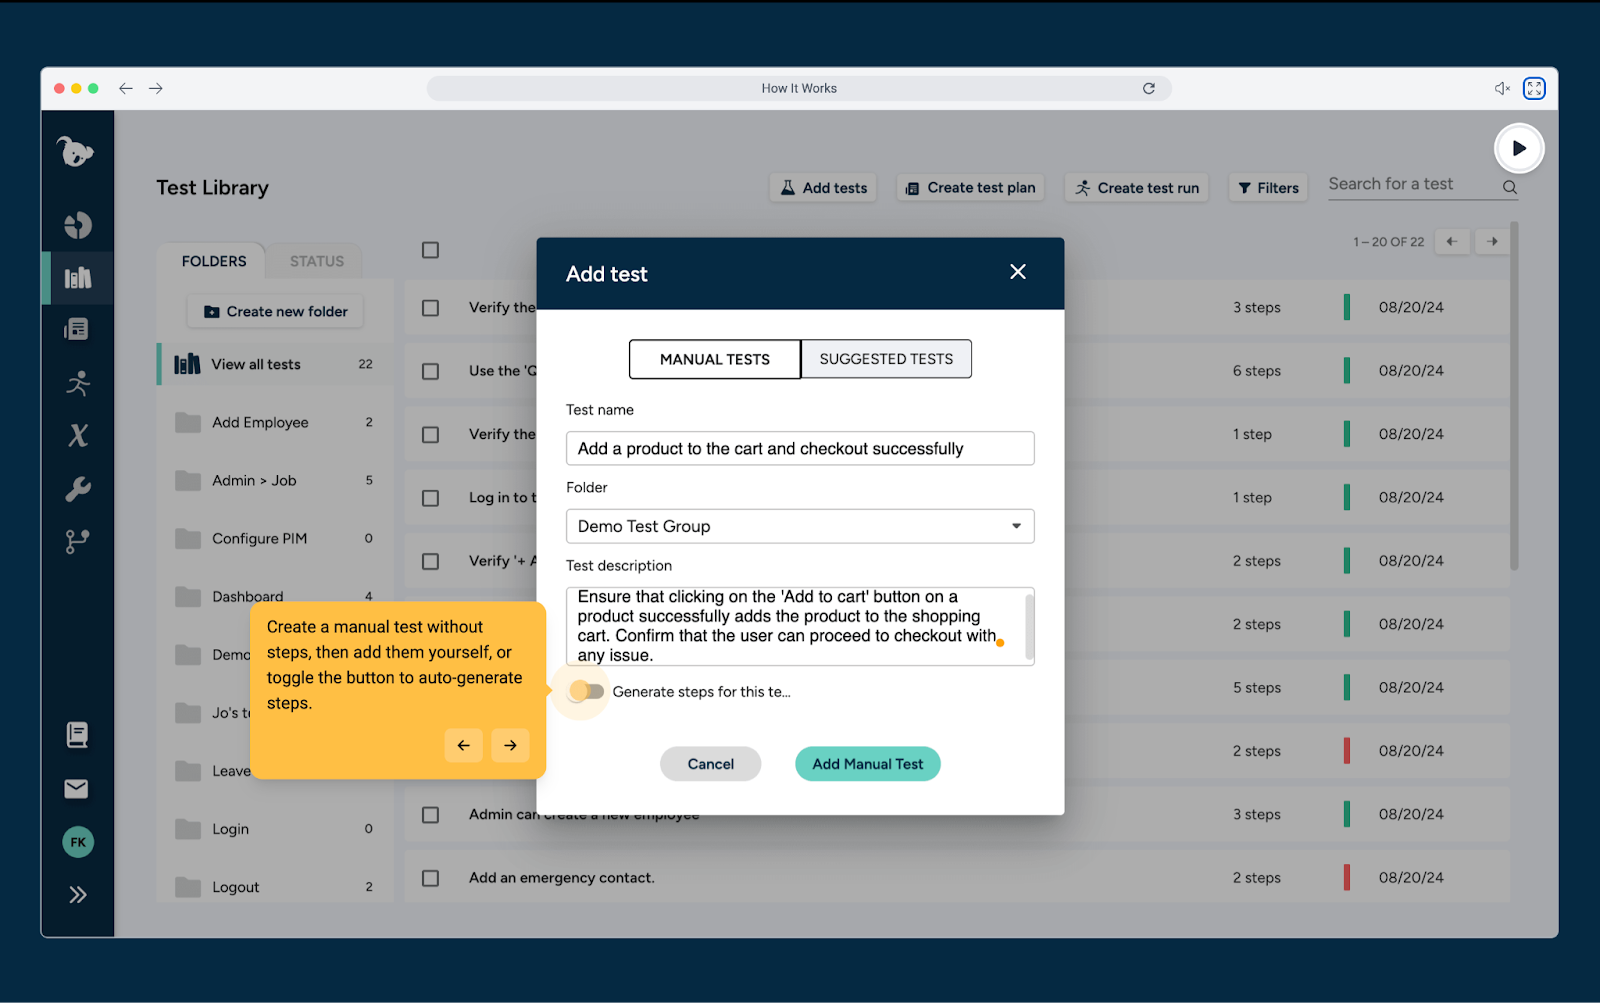
The platform’s test generation features can save time when creating tests. For example, prompts can be used to generate performance tests. Alternatively, specific testing steps can be dedicated to performance checks as workflows execute.
Qualiti automatically organizes test collections as folders. This makes it easy to track progress, identify performance bottlenecks, and continuously improve app performance. When tests return issues in production, you can alert relevant personnel using Qualiti’s notification settings.
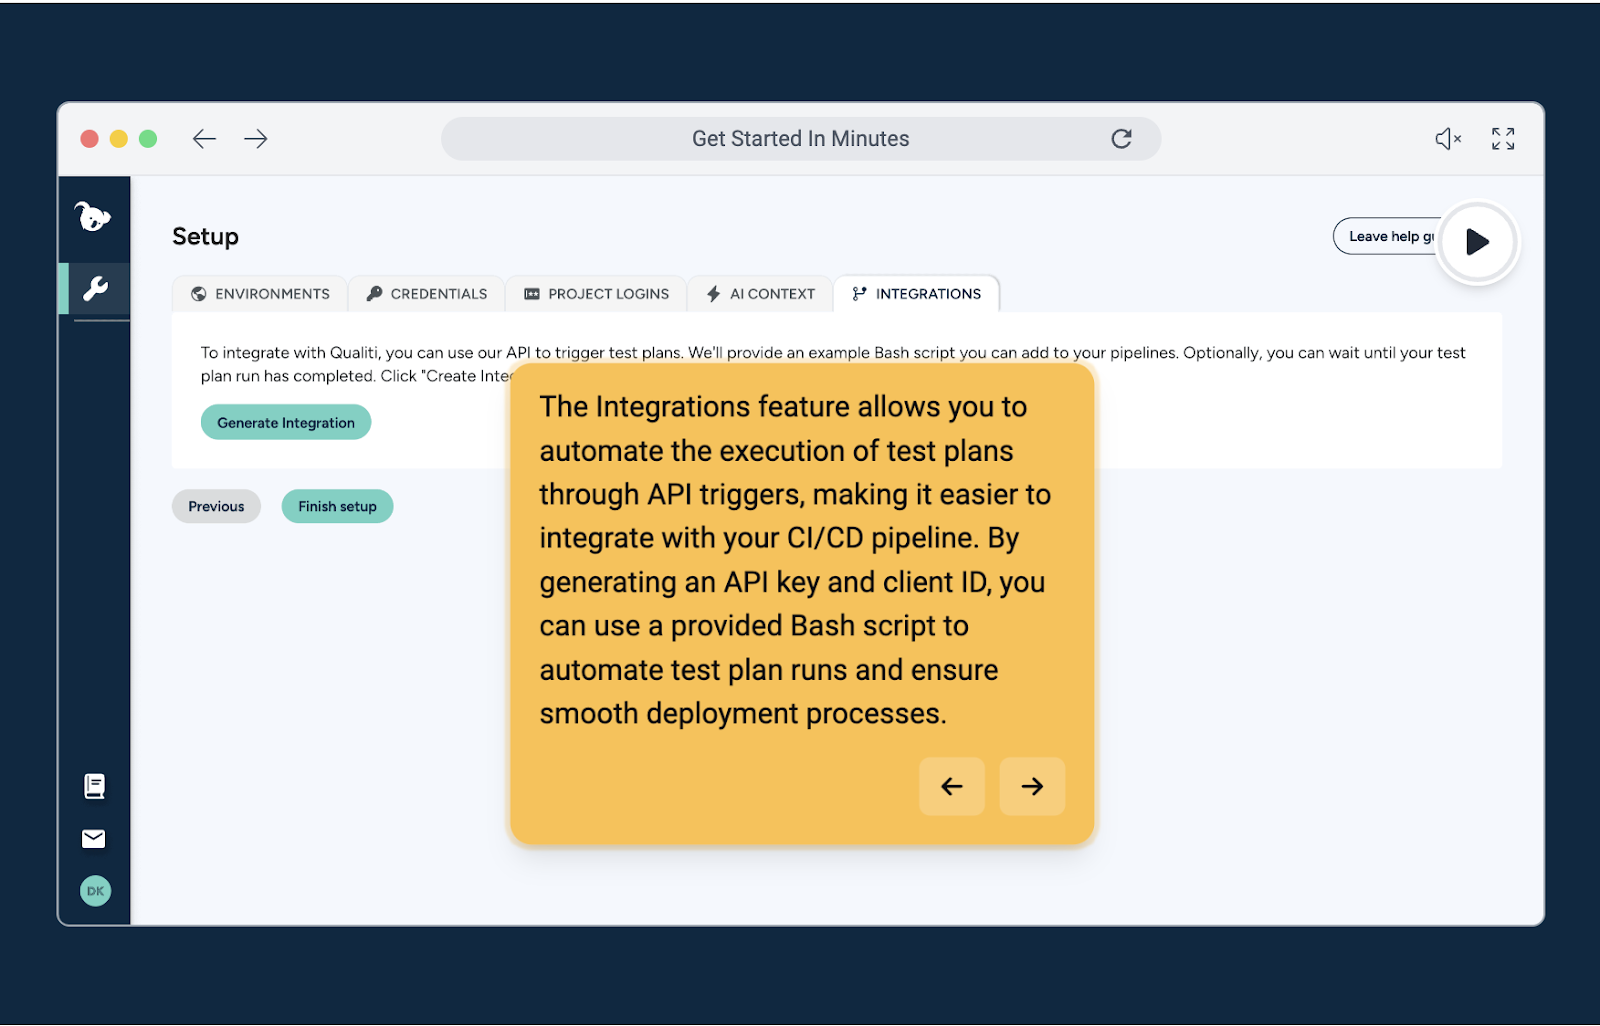
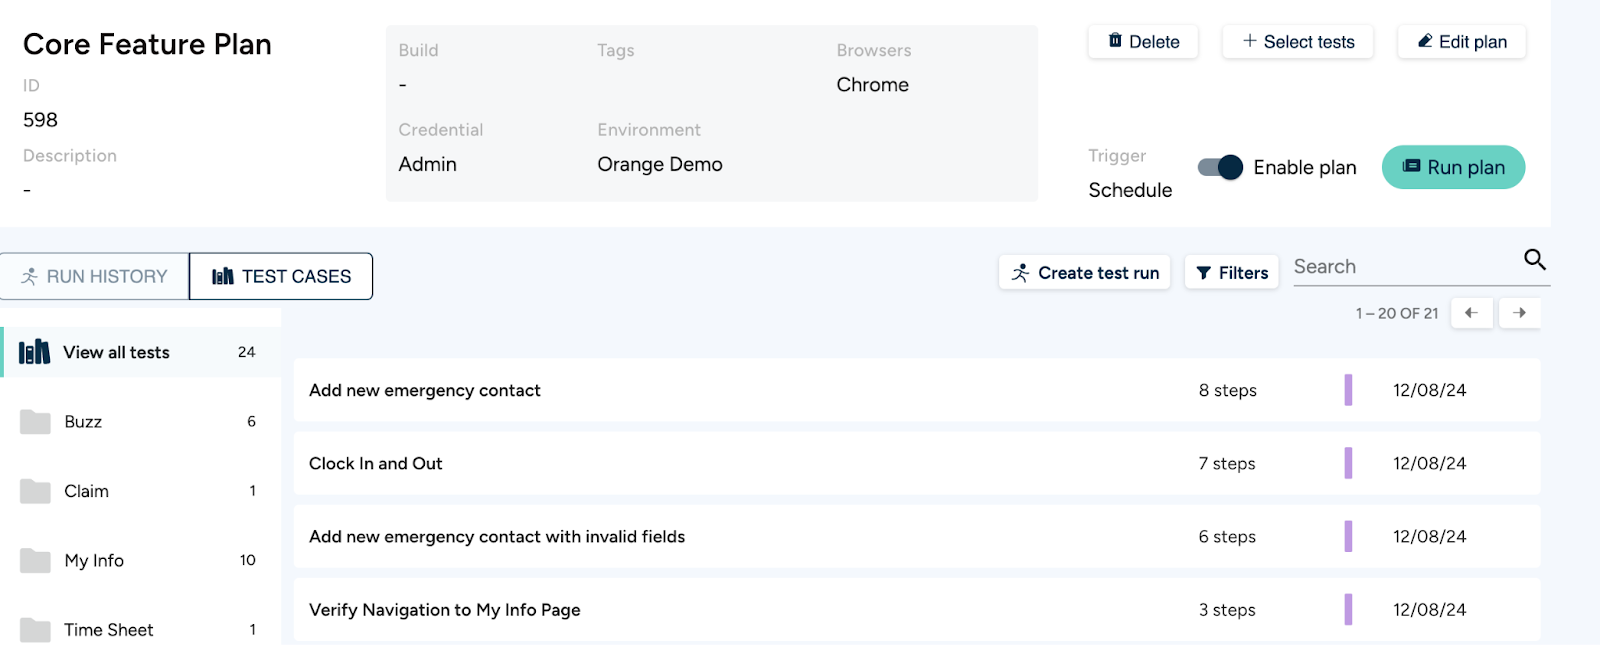
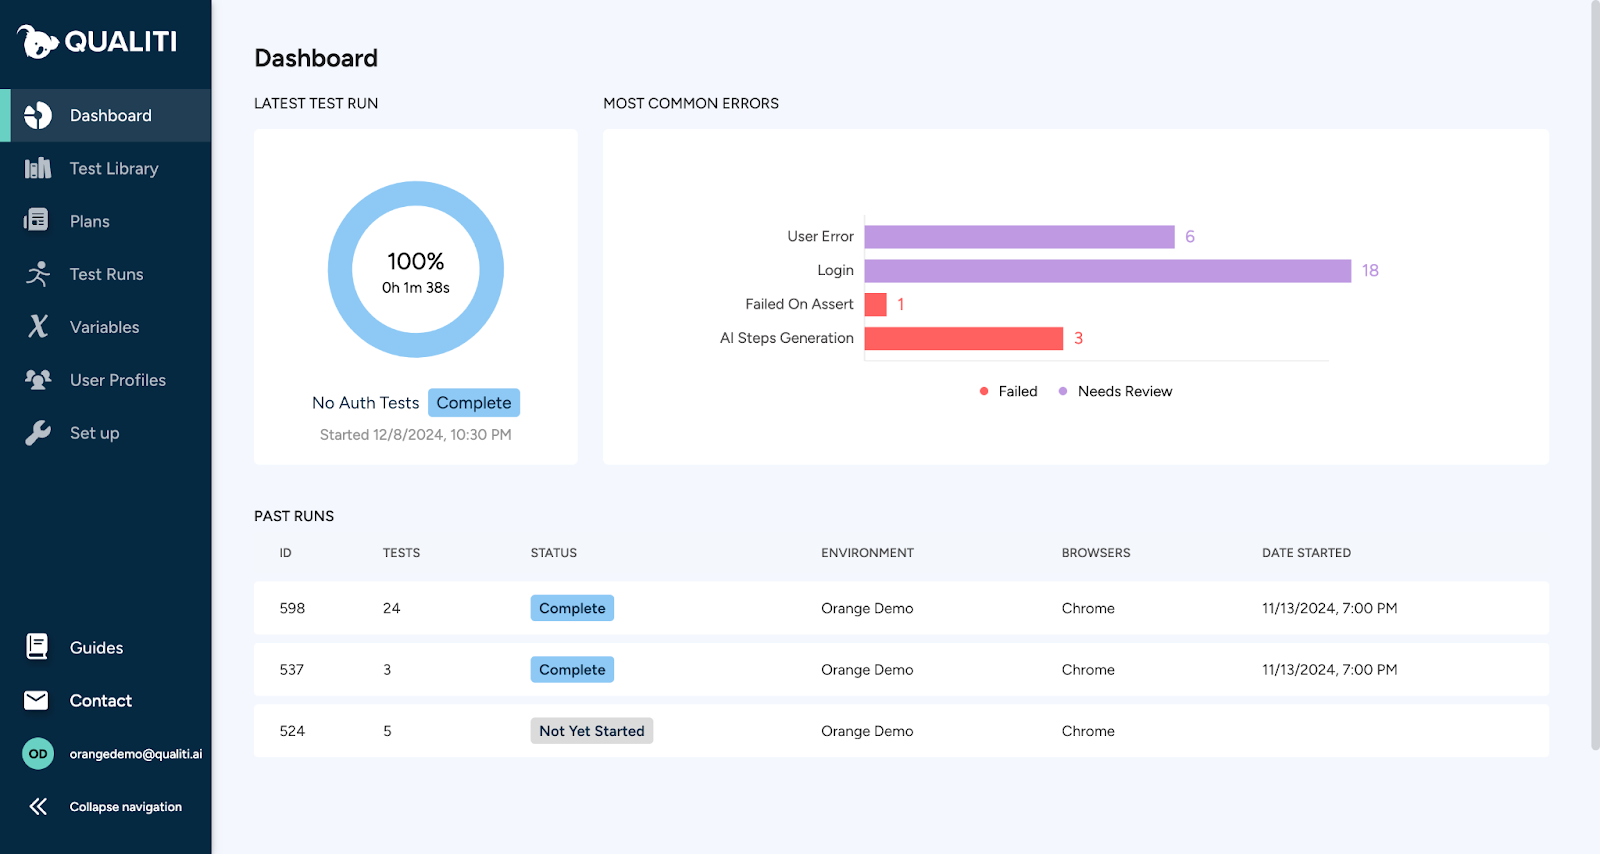
The intuitive dashboard also allows non-technical users to participate in testing. Using a UI for testing saves a great deal of time and reduces time spent coordinating between departments. Users can trigger tests, view the history of test runs, and schedule triggered testing:
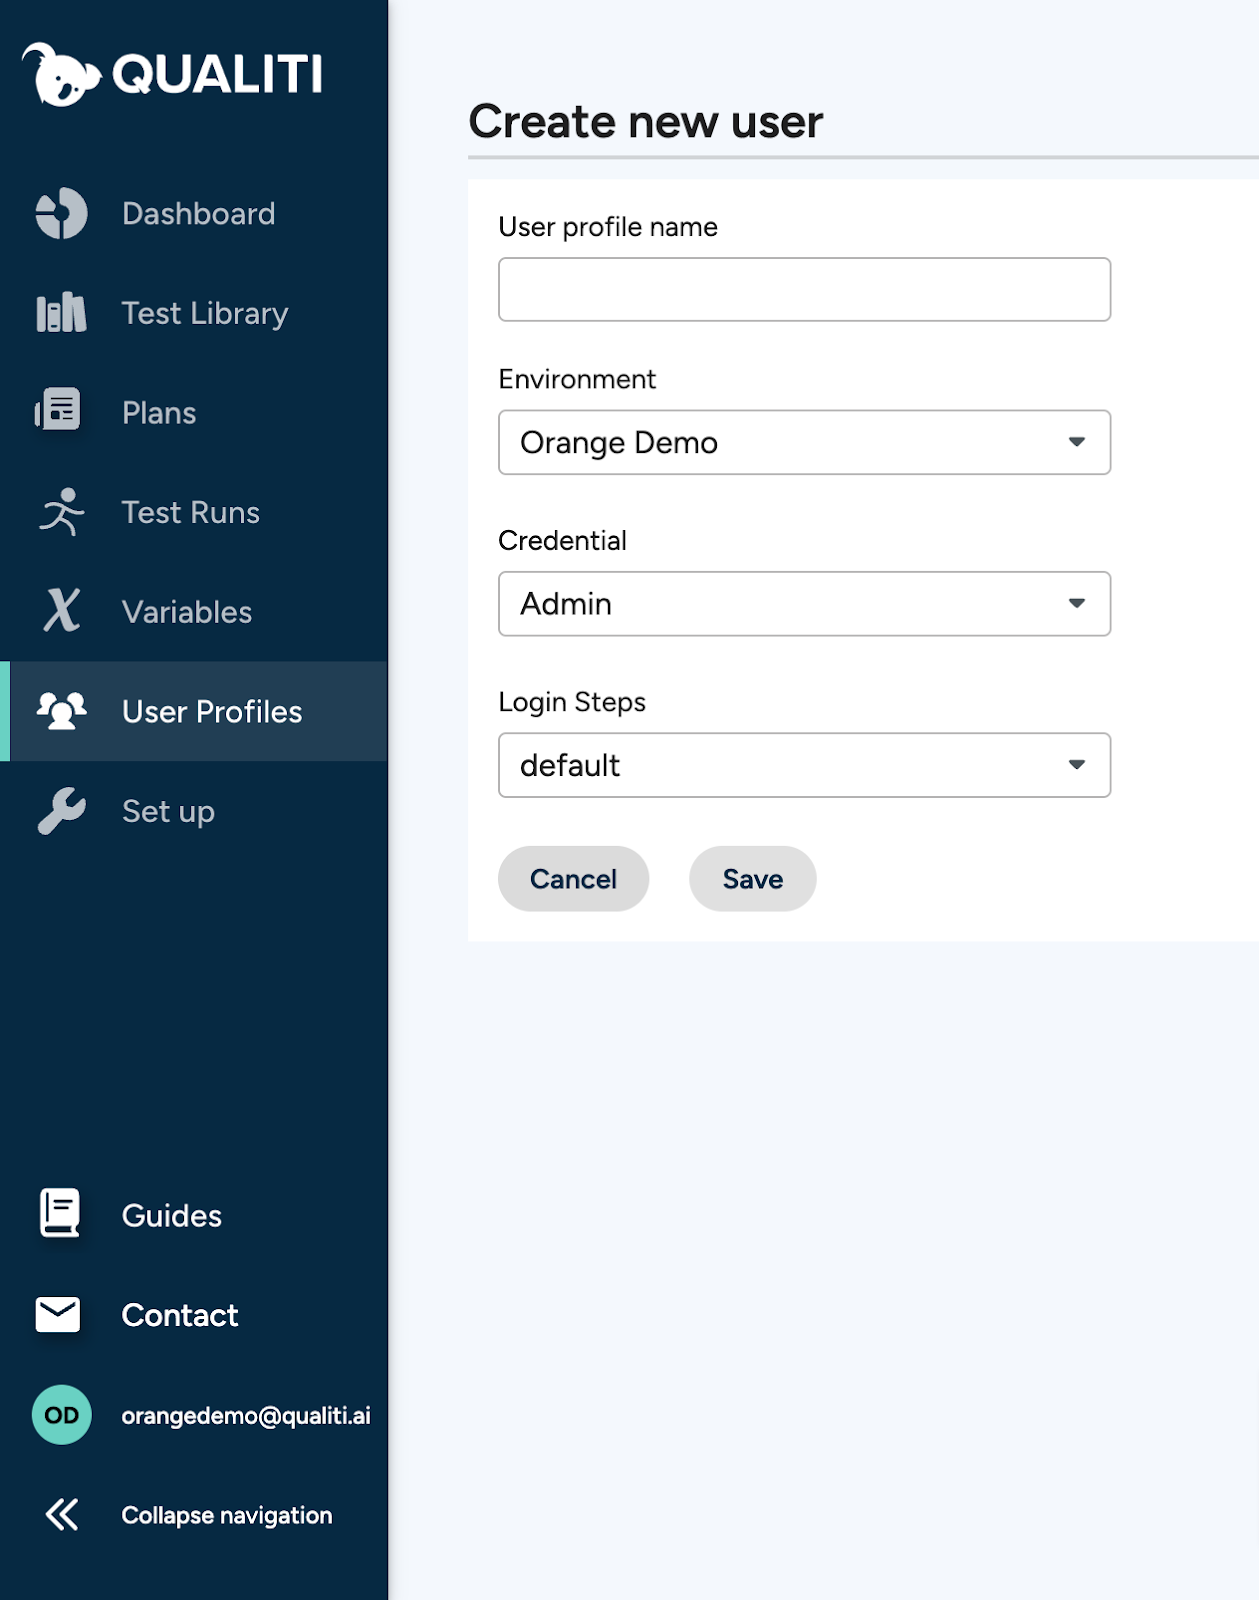
Users can be assigned to different environments, with their own credentials and login steps. Here we set up a new admin user, assigning them to our example environment. We sign the user in as an administrator and specify that our virtual admin will follow the default path for logging in:
The shared dashboard also serves as a place for teams to coordinate and stay in sync regarding recent tests and issues. Recent run info can quickly be shared across a team for quick response and resolution.
Qualiti reduces test suite maintenance time to minutes a day instead of hours each week, while boosting team collaboration. Try Qualiti for free today!
{{banner-small-4="/banners"}}
Conclusion
To test effectively, begin by defining a clear set of goals and requirements for testing efforts and then translate those goals into metrics and hard target numbers. This will inform the structure of the code you write in your test suite. Make sure to simulate real-world user needs as accurately as possible—mimic expected network, device, and resource constraints as closely as possible.
Playwright offers comprehensive features that allow teams to measure and optimize web application performance under various conditions. Developers can ensure that their apps meet modern performance standards by tracking page load times, network activity, and resource consumption metrics. In your code, consider the value of capturing metrics like FCP, LCP, and response times. When using tracing, pay attention to browser-based results like network request times and media download speeds.
Automation is key, and writing Playwright tests alone doesn’t guarantee full code coverage. Adding CI/CD integration is one approach to continuously running your tests and checking for new issues. Another is scheduled daily or weekly test runs, which may be preferable for large codebases.
No matter your requirements, these guidelines will serve as the basis for a scalable performance testing methodology. By following these principles and creating a robust automated test suite, you will ensure that long-term user experiences remain intact through comprehensive test coverage.

